Visualize a
Better World
Our Mission
Your work is changing the world. Your data proves it. Graphicacy helps organizations like yours turn complex data into informative, provocative, inspiring visual stories, through intuitive data visualizations of facts, figures, and trends – showing audiences why your mission matters and what their role is in the fight.
That’s the power of visual storytelling. It draws people in and connects them to the issue and your work on an emotional level. It creates an experience they can’t look away from. And it invites them to do something about it.
Together, we’ll visualize a better world… and inspire action to help create it—through interactive dashboards, data-driven reports, and powerful visual storytelling.
Featured Projects
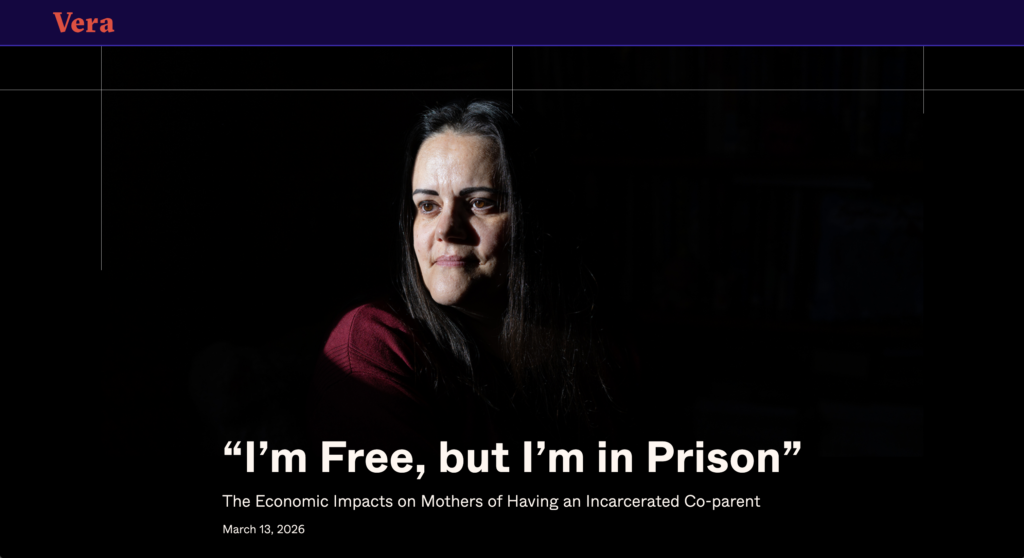
01 Vera Institute of Justice
Data Explainer Visualizes the Human Impact of Mass Incarceration
Data Visualization, Engineering, Interactive Web Applications, Scrollytelling, UX/UI Design
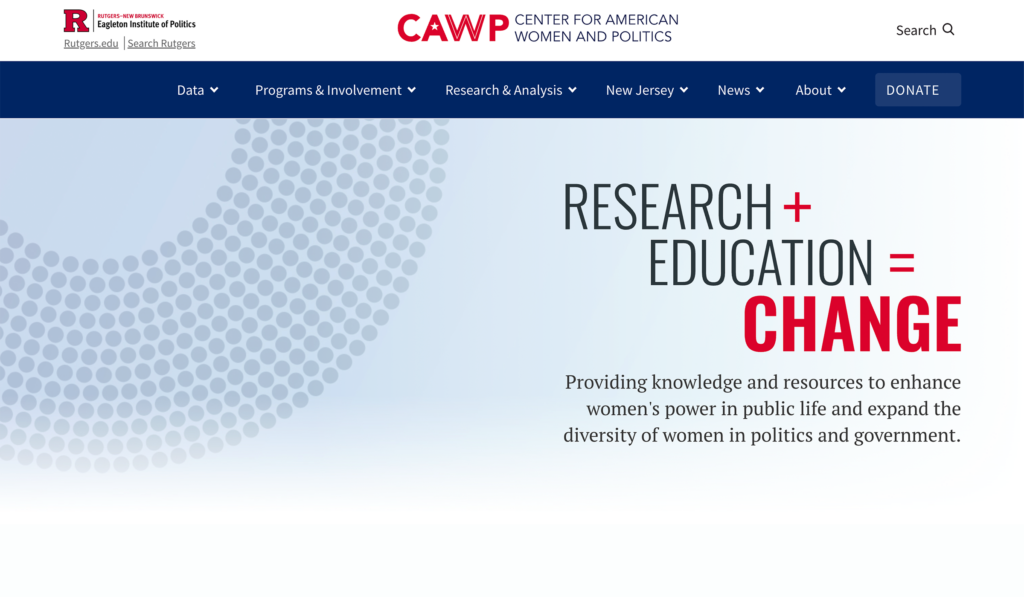
02 Center for American Women and Politics (CAWP)
Women and U.S. Politics: Understanding the Story through Data
CMS Integration, Data Management Solutions, Data Visualization, Engineering, Interactive Web Applications, UX/UI Design
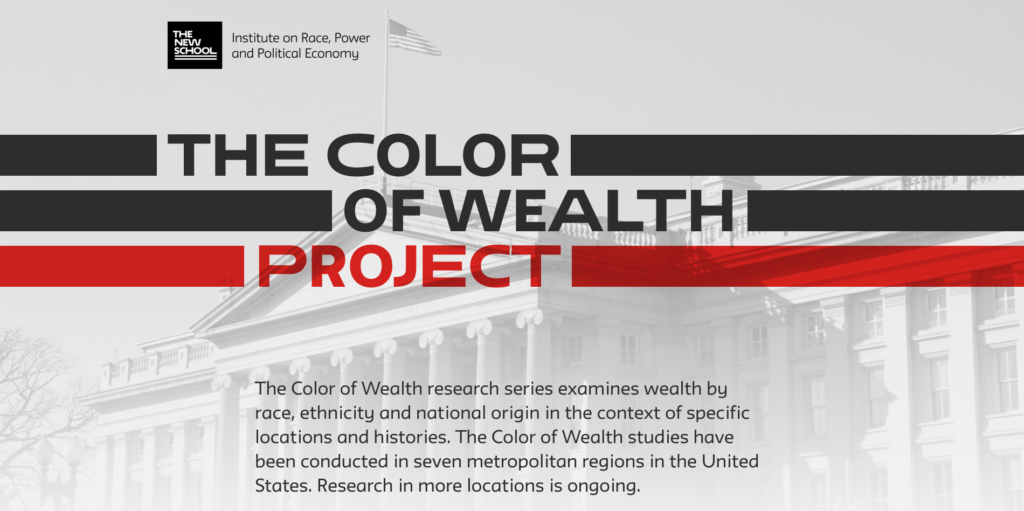
03 The New School: Institute on Race, Power, and Political Economy
Unveiling Inequities: Visualizing Wealth Disparities in America, City by City
Data Visualization, Engineering, Interactive Web Applications, Motion Graphics & Animation, Scrollytelling, UX/UI Design
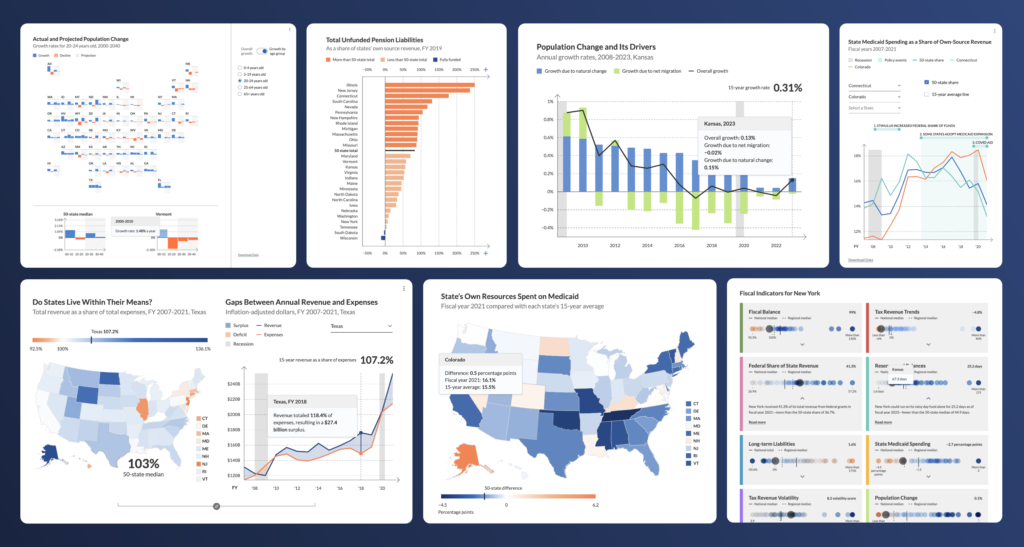
04 Pew Charitable Trusts
Revamping Pew’s Fiscal 50 with Dynamic Visualizations
CMS Integration, Data Management Solutions, Data Visualization, Engineering, Geospatial Mapping, Ideation & Prototyping, Information Design, Interactive Web Applications, UX/UI Design
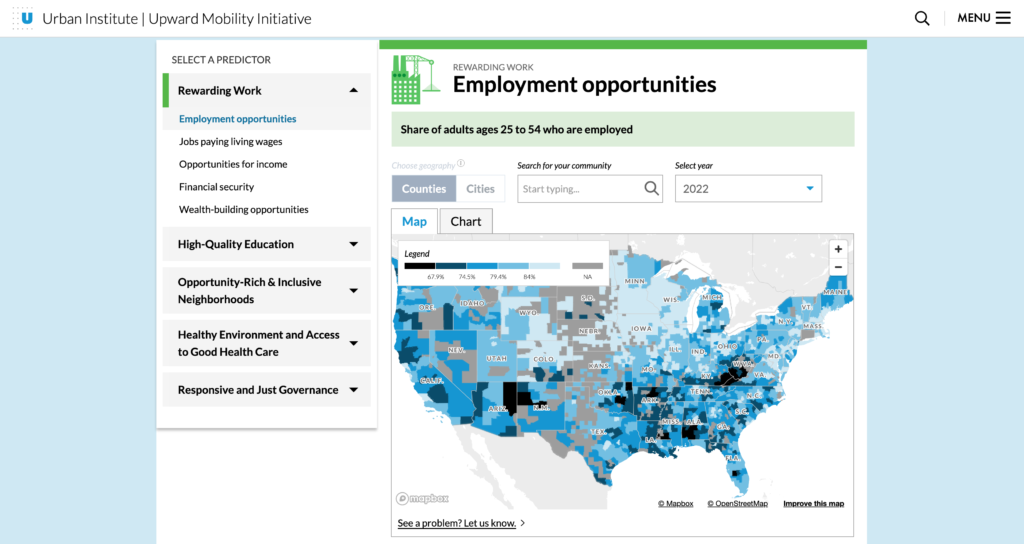
05 Urban Institute
Raising the Bar: Interactive Dashboard Elevates Upward Mobility Data
CMS Integration, Data Management Solutions, Data Visualization, Engineering, Geospatial Mapping, Interactive Web Applications, UX/UI Design
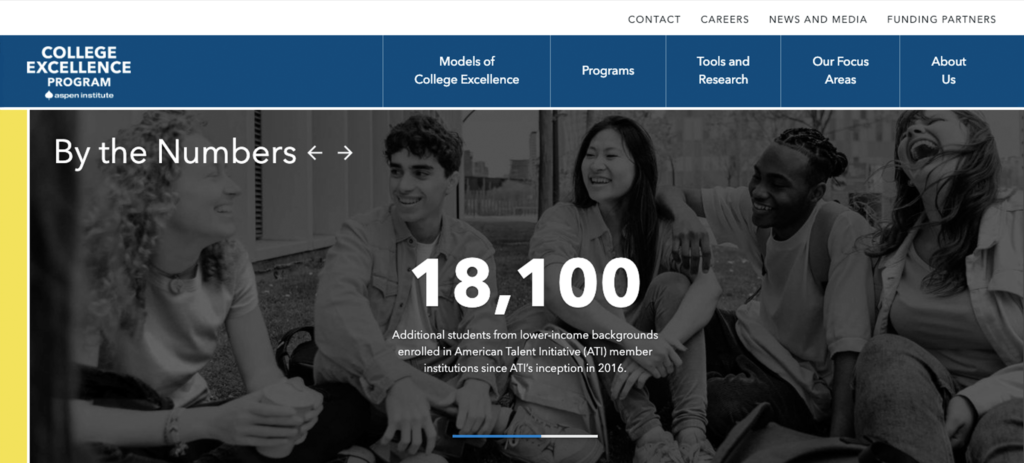
06 The Aspen Institute College Excellence Program
Reimagining a Digital Resource for Higher Education
CMS Integration, Data Management Solutions, Data Visualization, Engineering, Ideation & Prototyping, Interactive Web Applications, UX/UI Design
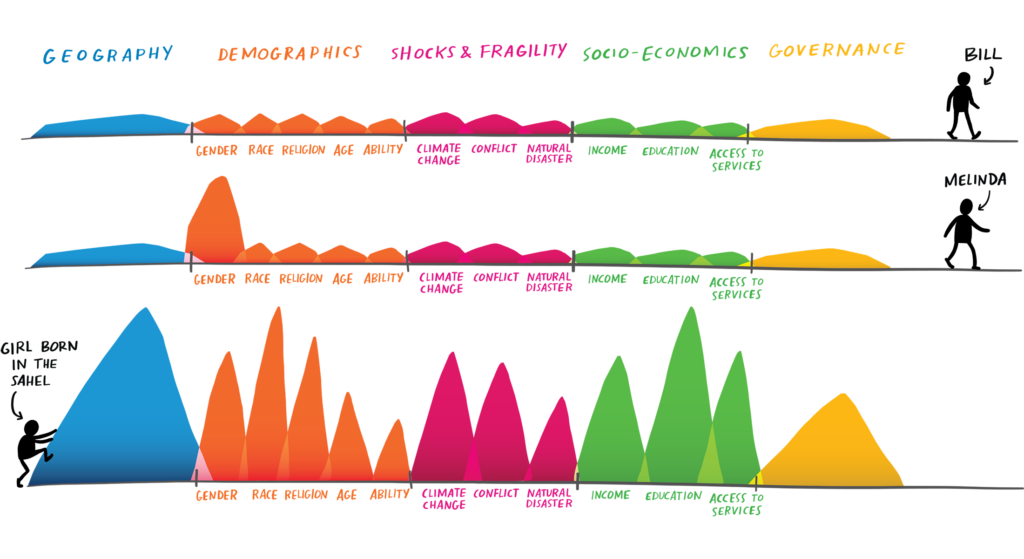
07 The Gates Foundation
Visualizing Inequality
Data Visualization, Information Design, Interactive Web Applications, Scrollytelling, UX/UI Design
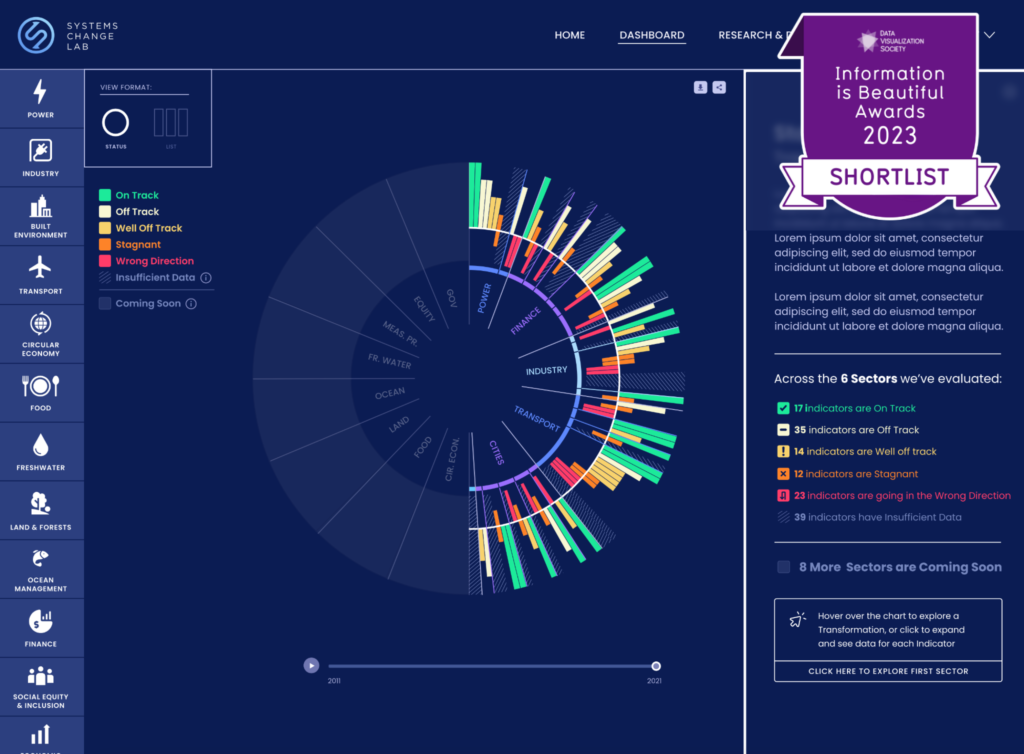
08 World Resources Institute
Depicting the Need for Systems Change
CMS Integration, Data Management Solutions, Data Visualization, Geospatial Mapping, Interactive Web Applications, UX/UI Design
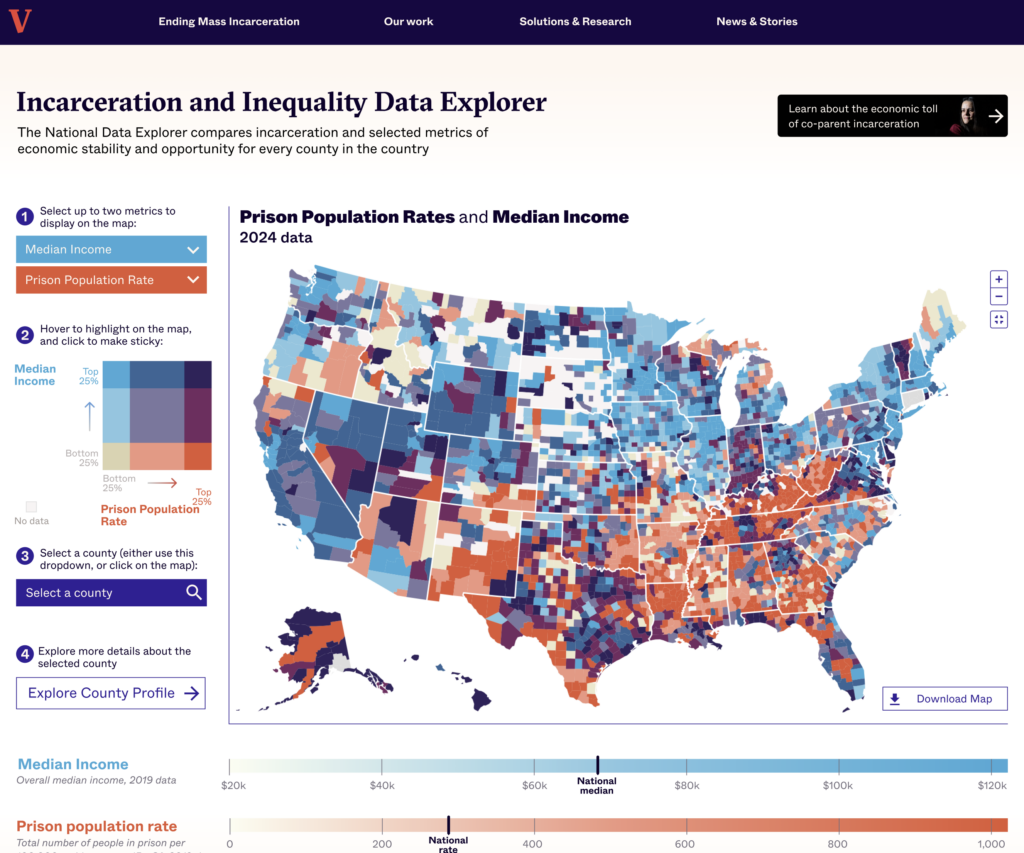
09 Vera Institute for Justice
Data Explorer Visualizes the Connections Between Incarceration and Inequality
CMS Integration, Data Visualization, Engineering, Information Design, Interactive Web Applications, UX/UI Design
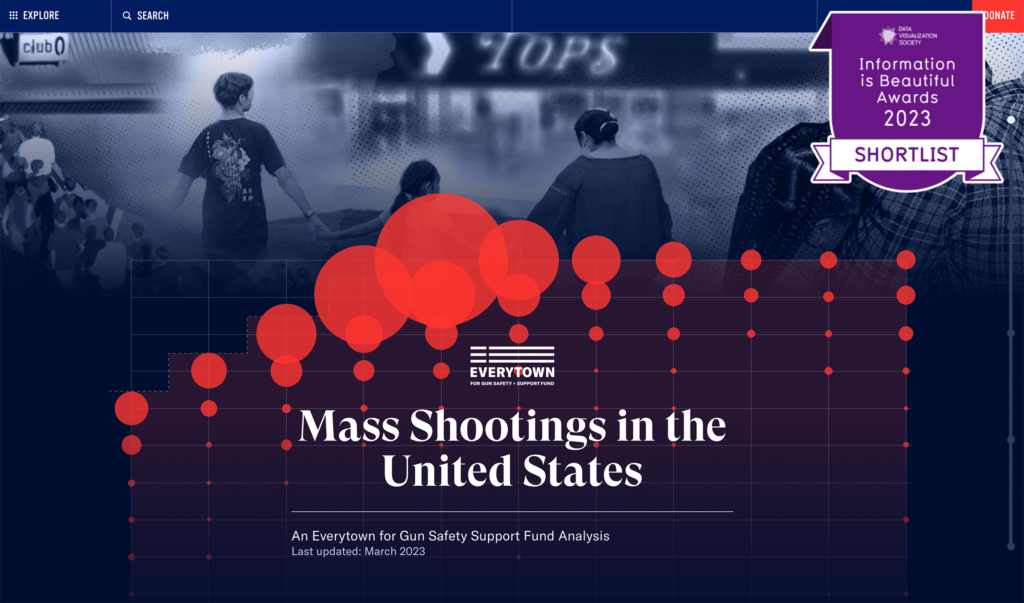
010 Everytown for Gun Safety
Visualizing Mass Shootings in the United States
Data Visualization, Ideation & Prototyping, Scrollytelling
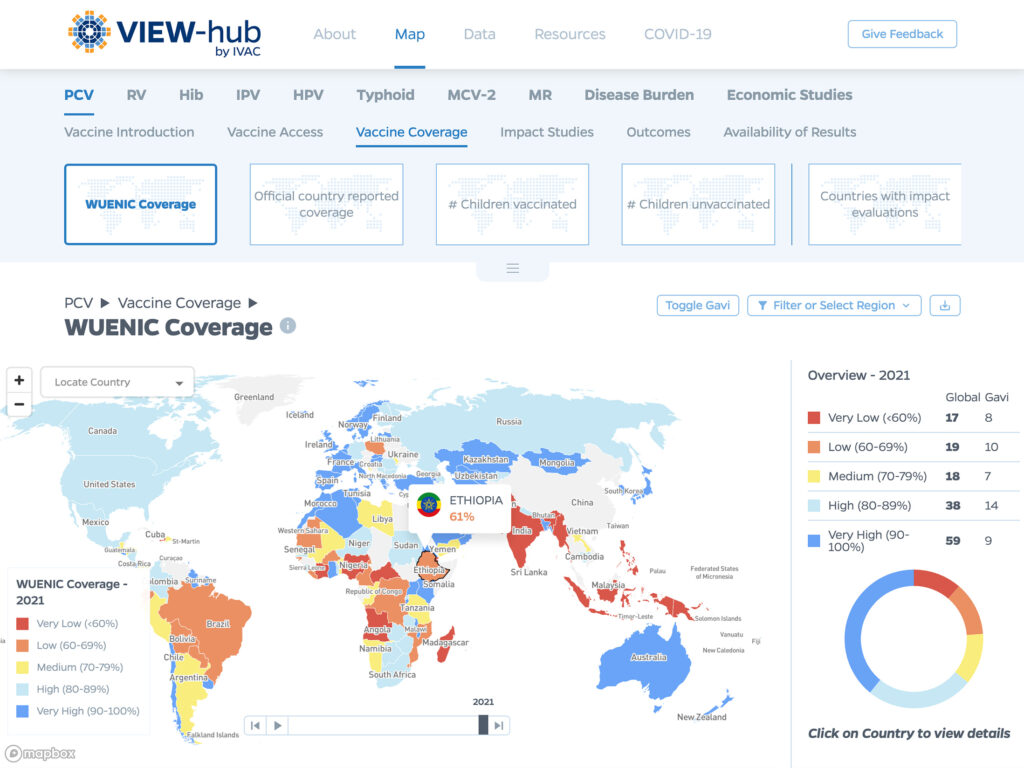
011 Johns Hopkins Bloomberg School of Public Health
A One-Stop Resource for Global Vaccine Data
CMS Integration, Data Management Solutions, Data Visualization, Geospatial Mapping, Information Design, Interactive Web Applications, UX/UI Design
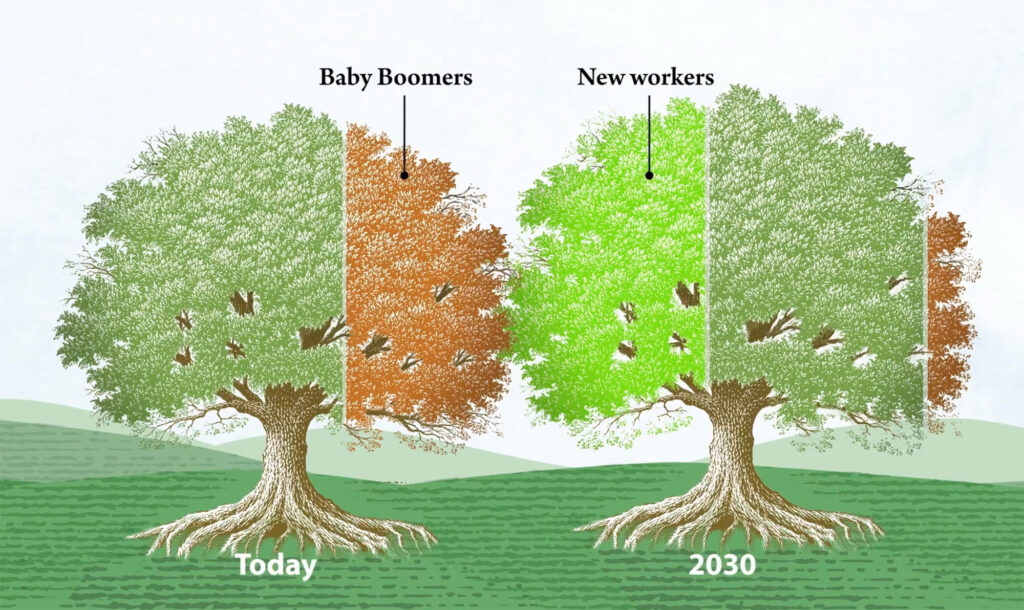
012 Center for American Progress
Our Future, Together: Immigrants & the American Economy
Data Visualization, Information Design, Interactive Web Applications, Motion Graphics & Animation, UX/UI Design
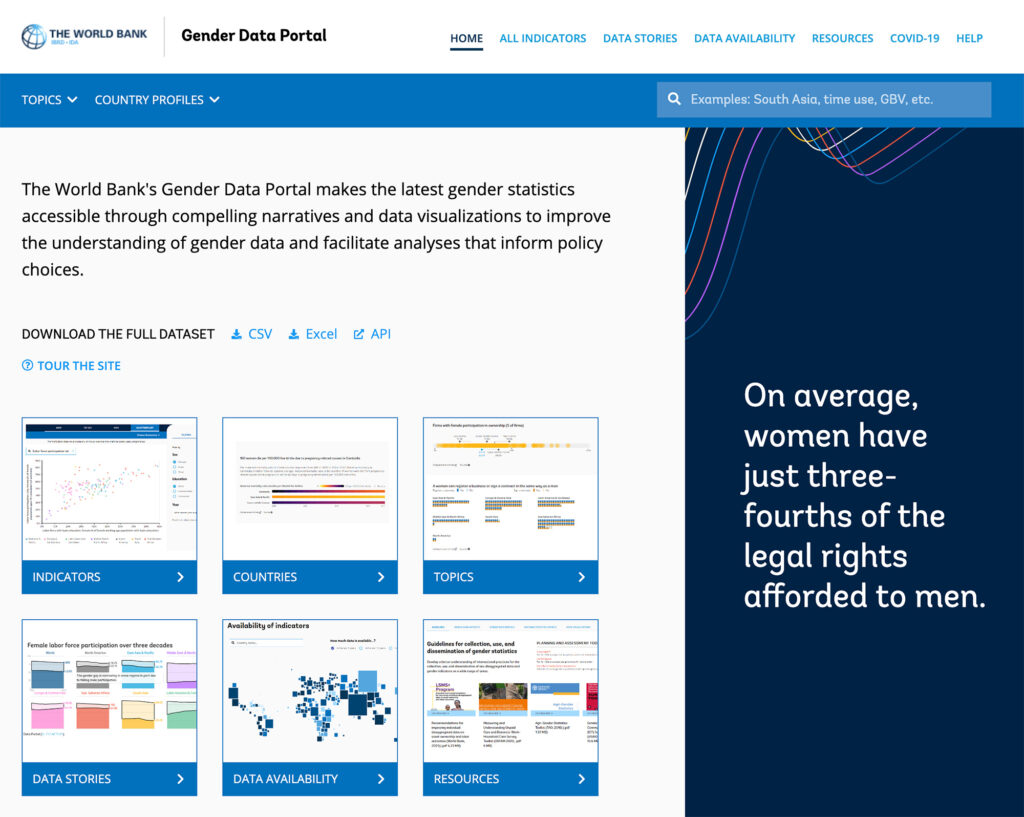
013 The World Bank Group
Revealing the Global Realities of Gender Equality in New Ways
CMS Integration, Data Management Solutions, Data Visualization, Geospatial Mapping, Interactive Web Applications, UX/UI Design
What Clients Are Saying About Graphicacy
“Graphicacy takes a sentence we give them and makes something beautiful out of it. I call them our fairy godparents. They take our ideas and make them reality, or even better.”
“In many ways, Graphicacy functioned as an extension of our in-house engineering and communications team from the very start. Our different strengths complemented each other nicely throughout the entire process.”
Graphicacy gave us new alternatives and a visual language that’s more cohesive with our overall brand. The home page alone now tells a much more engaging story of who we are and what we do.”
“Working with Graphicacy was so smooth and easy. Often, we had some vague ideas, but they would jump in and turn them into usable design concepts. We wouldn’t have ended up where we did without their contributions. I’d recommend Graphicacy to anyone thinking about doing projects like these.”
“I was impressed by how quickly the Graphicacy team grasped what we were trying to do. Storytelling is at the heart of the training we do with potential candidates. Graphicacy’s approach felt like a natural extension of that. They zeroed in on the most impactful pieces of data.”